
Performance Monitor gives you graphs. Get-Counter gives you data — in the terminal, in variables, in CSV files, in scripts that run unattended at 3am. It reads the same performance counter infrastructure that PerfMon uses, but from PowerShell, which means you can filter, format, export, and compare without touching a GUI. This article covers everything from reading a single live counter to building a multi-day logging loop — the foundation for the rest of the PerfMon troubleshooting series on this site.
Applies to: Windows Server 2016 / 2019 / 2022, Windows 10 / 11
Quick answer
Read CPU, available RAM, disk queue, and network throughput right now:
Get-Counter '\Processor(_Total)\% Processor Time',
            '\Memory\Available MBytes',
            '\PhysicalDisk(_Total)\Avg. Disk Queue Length',
            '\Network Interface(*)\Bytes Total/sec'
Log every 60 seconds to CSV indefinitely:
while ($true) {
    Get-Counter '\Processor(_Total)\% Processor Time' |
        Select-Object -ExpandProperty CounterSamples |
        Select-Object Timestamp, CookedValue |
        Export-Csv -Path C:\perf\cpu-log.csv -Append -NoTypeInformation
    Start-Sleep -Seconds 60
}
What it does
Get-Counter reads Windows performance counters — the same data source used by Performance Monitor, Task Manager, and Resource Monitor. It queries the counter once (or repeatedly, with -Continuous or -MaxSamples), and returns a structured object you can pipe, filter, or export.
Basic syntax:
Get-Counter [[-Counter] <string[]>] [-ComputerName <string[]>]
[-SampleInterval <int>] [-MaxSamples <long>] [-Continuous]| Parameter | Purpose |
|---|---|
-Counter | One or more counter paths (strings starting with \) |
-SampleInterval | Seconds between samples (default: 1) |
-MaxSamples | How many samples to collect then stop |
-Continuous | Run indefinitely until Ctrl+C |
-ComputerName | Query a remote machine by name |
Get-Counter is part of the Microsoft.PowerShell.Diagnostics module, which is included in PowerShell 5.1 and PowerShell 7+ on Windows. It is not available on Linux or macOS — it reads Windows-specific performance counter APIs.
Counter paths explained
Every counter has a path in this format:
\Object(Instance)\CounterFor example: \Processor(0)\% Processor Time — Object is Processor, Instance is 0 (first CPU core), Counter is % Processor Time. Use _Total as the instance to get the aggregate across all cores or all disks.
To find all available counters on your system:
# List all counter sets available on this machine
Get-Counter -ListSet * | Select-Object CounterSetName | Sort-Object CounterSetName
# List all counters inside a specific set — example: Memory
Get-Counter -ListSet Memory | Select-Object -ExpandProperty PathsOutput example:
\Memory\Page Faults/sec
\Memory\Available Bytes
\Memory\Committed Bytes
\Memory\Commit Limit
\Memory\% Committed Bytes In Use
\Memory\Available KBytes
\Memory\Available MBytes
\Memory\Pages/sec
...Get-Counter -ListSet * to find the correct local name, or switch the system locale to English for server environments to avoid this issue entirely.
Practical examples
1. Read a single counter value right now
The problem: You are connected to a server via RDP or SSH and you need a quick reading of CPU load, available RAM, or disk queue — without opening Task Manager or Performance Monitor.
The solution: Call Get-Counter with a single counter path. The result includes a timestamp and the current value as a floating-point number (CookedValue).
# Read current CPU usage across all cores
Get-Counter '\Processor(_Total)\% Processor Time'
Output:
Timestamp                 CounterSamples
---------                 --------------
4/28/2026 10:14:03 AM     \\srv-prod-01\processor(_total)\% processor time :
                          42.3891...
To get just the number — extract CookedValue:
# Extract just the numeric value — useful for comparisons and scripts
(Get-Counter '\Processor(_Total)\% Processor Time').CounterSamples.CookedValue
Round it for readability:
# Round to 1 decimal place
[Math]::Round(
    (Get-Counter '\Processor(_Total)\% Processor Time').CounterSamples.CookedValue,
    1
)
2. Read multiple counters in one call
The problem: You need a snapshot of several metrics at once — CPU, memory, and disk — ideally at the same timestamp so you can correlate them. Running three separate commands takes time and produces staggered timestamps.
The solution: Pass an array of counter paths to a single Get-Counter call. All values are sampled at the same moment.
# Read CPU, available RAM, and disk queue in a single sample
$sample = Get-Counter @(
    '\Processor(_Total)\% Processor Time',
    '\Memory\Available MBytes',
    '\PhysicalDisk(_Total)\Avg. Disk Queue Length'
)

# Display all three values with labels
foreach ($s in $sample.CounterSamples) {
    [PSCustomObject]@{
        Counter = $s.Path.Split('\')[-1]   # short name only
        Value   = [Math]::Round($s.CookedValue, 2)
    }
}
Output:
Counter                   Value
-------                   -----
% Processor Time          67.84
Available MBytes         1842.00
Avg. Disk Queue Length      0.12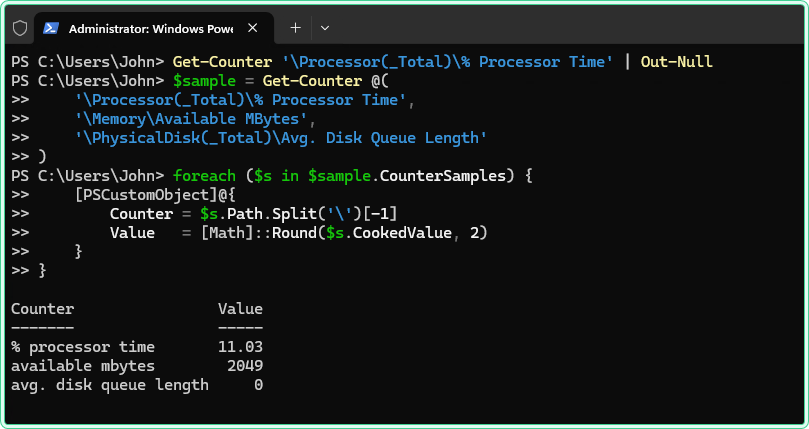
3. Collect samples over time with -MaxSamples
The problem: You want to observe how CPU usage behaves over a short period — say, 5 minutes at 30-second intervals — without staying in the terminal and running commands manually.
The solution: Use -MaxSamples and -SampleInterval together. PowerShell blocks until all samples are collected, then returns all results at once.
# Collect 10 samples, one every 30 seconds (5 minutes total)
# PowerShell will wait here until all samples are collected
$samples = Get-Counter '\Processor(_Total)\% Processor Time' `
    -SampleInterval 30 `
    -MaxSamples 10

# Display timestamp and value for each sample
$samples.CounterSamples | Select-Object Timestamp,
    @{Name='CPU_%'; Expression={[Math]::Round($_.CookedValue, 1)}}
Output:
Timestamp              CPU_%
---------              -----
4/28/2026 10:20:00 AM  12.4
4/28/2026 10:20:30 AM  18.9
4/28/2026 10:21:00 AM  67.3
4/28/2026 10:21:30 AM  89.1
4/28/2026 10:22:00 AM  91.4
...-MaxSamples, Get-Counter blocks the terminal for the entire collection period. If you close the PowerShell window or press Ctrl+C before all samples are collected, no data is returned — the collection is lost. For unattended long-running collection, use a while loop with Export-Csv instead (see Example 4).
4. Log to CSV for long-term analysis
The problem: You need to monitor a server over several hours or days to catch intermittent spikes — the kind that happen at 2am or during a batch job — and you need the data in a format you can open in Excel afterward.
The solution: A while loop with Export-Csv -Append writes each sample to disk immediately. If the session closes, all data collected so far is already saved. This is the PowerShell equivalent of a PerfMon Data Collector Set.
# Long-term performance logger — writes one row per interval to CSV
# Run in an elevated PowerShell session
# Stop with Ctrl+C when done
$OutputPath = 'C:\perf\srv-prod-01-log.csv'
# Create output folder if it does not exist
if (-not (Test-Path 'C:\perf')) {
New-Item -Path 'C:\perf' -ItemType Directory | Out-Null
}
Write-Host "Logging to $OutputPath — press Ctrl+C to stop"
while ($true) {
# Capture all three counters at the same timestamp
$sample = Get-Counter @(
'\Processor(_Total)\% Processor Time',
'\Memory\Available MBytes',
'\PhysicalDisk(_Total)\Avg. Disk Queue Length'
) -ErrorAction SilentlyContinue
if ($sample) {
$cs = $sample.CounterSamples
# Build one row per sample interval
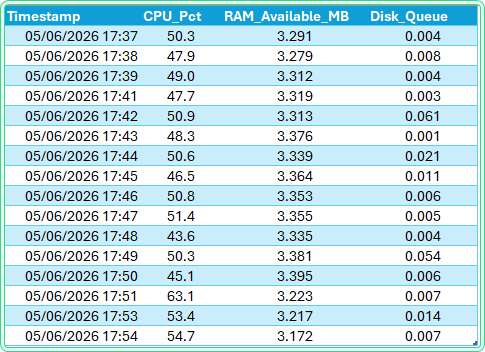
[PSCustomObject]@{
Timestamp = $cs[0].Timestamp
CPU_Pct = [Math]::Round($cs[0].CookedValue, 1)
RAM_Available_MB = [Math]::Round($cs[1].CookedValue, 0)
Disk_Queue = [Math]::Round($cs[2].CookedValue, 3)
} | Export-Csv -Path $OutputPath -Append -NoTypeInformation
}
Start-Sleep -Seconds 60 # adjust interval: 30 for faster, 300 for 5-minute snapshots
}
5. Query a remote server
The problem: A server in another office or subnet is showing high load, but you cannot get a GUI session on it. You need performance counter data from your local PowerShell terminal.
The solution: Use -ComputerName to query a remote machine. WinRM must be enabled on the target.
# Read CPU and available RAM from a remote server
Get-Counter '\Processor(_Total)\% Processor Time',
            '\Memory\Available MBytes' `
    -ComputerName SRV-PROD-02
# Query multiple remote servers at once — useful for a quick cluster health check
$servers = 'SRV-PROD-01', 'SRV-PROD-02', 'SRV-DB-01'
Get-Counter '\Processor(_Total)\% Processor Time' -ComputerName $servers |
Select-Object -ExpandProperty CounterSamples |
Select-Object @{Name='Server'; Expression={$_.Path.Split('\\')[2]}},
@{Name='CPU_%'; Expression={[Math]::Round($_.CookedValue, 1)}}Output:
Server        CPU_%
------        -----
srv-prod-01   22.4
srv-prod-02   89.1
srv-db-01 11.7Enable-PSRemoting -Force) and the current session to have administrator rights on the remote machine. Firewall rules must allow WinRM (TCP 5985 by default). If WinRM is not available, use PerfMon with /S computername from the GUI instead.
6. Alert when a threshold is crossed
The problem: You want to be notified in the terminal (or in a log file) when CPU goes above 85% — without watching the screen yourself.
The solution: Add a threshold check inside the collection loop. Write an alert to the console and optionally to a separate alert log.
# Monitor CPU and log an alert line when it exceeds the threshold
$Threshold    = 85        # alert if CPU goes above this percentage
$AlertLog     = 'C:\perf\alerts.txt'
$SampleSecs   = 60

while ($true) {
    $cpu = [Math]::Round(
        (Get-Counter '\Processor(_Total)\% Processor Time').CounterSamples.CookedValue,
        1
    )

    $ts = Get-Date -Format 'yyyy-MM-dd HH:mm:ss'

    if ($cpu -gt $Threshold) {
        $msg = "$ts  ALERT  CPU at $cpu% — exceeds threshold of $Threshold%"
        Write-Host $msg -ForegroundColor Red
        Add-Content -Path $AlertLog -Value $msg
    } else {
        Write-Host "$ts  OK     CPU at $cpu%"
    }

    Start-Sleep -Seconds $SampleSecs
}
Output when threshold is crossed:
2026-04-28 10:45:00  OK     CPU at 34.2%
2026-04-28 10:46:00  OK     CPU at 41.8%
2026-04-28 10:47:00  ALERT  CPU at 91.3% — exceeds threshold of 85%
2026-04-28 10:48:00 ALERT CPU at 88.7% — exceeds threshold of 85%C:\perf\alerts.txt using Add-Content, which appends without overwriting. The file persists between runs. For production use, consider sending alerts via email using Send-MailMessage or writing to the Windows Event Log with Write-EventLog instead of a text file.
7. Monitor network interface throughput
The problem: A server is slow but CPU and RAM look normal. The next suspect is network saturation — either the NIC is hitting its limit, or a specific process is generating unexpected traffic. You need bytes per second and packet rates per interface, not just a total.
The solution: The Network Interface counter object exposes per-adapter metrics. First, list the available adapter instances on your server — instance names include the adapter model and sometimes the slot number.
# List all network adapter instances available as counter instances
Get-Counter -ListSet 'Network Interface' | Select-Object -ExpandProperty PathsWithInstances |
    Where-Object { $_ -like '*Bytes Total/sec*' }
Output example — copy the exact instance name from here for the next commands:
\Network Interface(Intel[R] Ethernet Connection I217-LM)\Bytes Total/sec
\Network Interface(vmxnet3 Ethernet Adapter)\Bytes Total/sec
Read throughput and packet rates for all adapters at once using the wildcard instance *:
# Read bytes/sec and packets/sec for all network adapters — warm-up first
Get-Counter '\Network Interface(*)\Bytes Total/sec' | Out-Null
Start-Sleep -Seconds 2

$sample = Get-Counter @(
    '\Network Interface(*)\Bytes Total/sec',
    '\Network Interface(*)\Packets/sec',
    '\Network Interface(*)\Packets Received Errors'
)

$sample.CounterSamples |
    Where-Object { $_.CookedValue -gt 0 } |     # skip adapters with zero traffic
    Select-Object @{Name='Adapter';   Expression={ ($_.InstanceName -split '\\')[-1] }},
                  @{Name='Metric';    Expression={ $_.Path.Split('\')[-1] }},
                  @{Name='Value';     Expression={ [Math]::Round($_.CookedValue, 1) }} |
    Sort-Object Adapter, Metric
To convert bytes/sec to megabits/sec for easier reading against NIC speed (e.g., 1 Gbps = 125 MB/s):
# Show network throughput in Mbps per adapter
Get-Counter '\Network Interface(*)\Bytes Total/sec' | Out-Null
Start-Sleep -Seconds 2

Get-Counter '\Network Interface(*)\Bytes Total/sec' |
    Select-Object -ExpandProperty CounterSamples |
    Where-Object { $_.CookedValue -gt 0 } |
    Select-Object @{Name='Adapter'; Expression={ $_.InstanceName }},
                  @{Name='Mbps';    Expression={ [Math]::Round($_.CookedValue * 8 / 1MB, 2) }}
Log network throughput alongside CPU and RAM to the same CSV for correlation:
# Extended logger: CPU + RAM + Network (total bytes/sec across all adapters)
# Aggregates all adapter instances into one Network_Bps column
$OutputPath = 'C:\perf\srv-prod-01-full.csv'

if (-not (Test-Path 'C:\perf')) { New-Item -Path 'C:\perf' -ItemType Directory | Out-Null }

Write-Host "Logging to $OutputPath — press Ctrl+C to stop"

while ($true) {
    $cpu  = Get-Counter '\Processor(_Total)\% Processor Time' -ErrorAction SilentlyContinue
    $mem  = Get-Counter '\Memory\Available MBytes'             -ErrorAction SilentlyContinue
    $net  = Get-Counter '\Network Interface(*)\Bytes Total/sec' -ErrorAction SilentlyContinue

    # Sum bytes/sec across all adapters into a single value
    $netTotal = ($net.CounterSamples | Measure-Object -Property CookedValue -Sum).Sum

    [PSCustomObject]@{
        Timestamp        = (Get-Date)
        CPU_Pct          = [Math]::Round($cpu.CounterSamples[0].CookedValue, 1)
        RAM_Available_MB = [Math]::Round($mem.CounterSamples[0].CookedValue, 0)
        Network_Bps      = [Math]::Round($netTotal, 0)
        Network_Mbps     = [Math]::Round($netTotal * 8 / 1MB, 3)
    } | Export-Csv -Path $OutputPath -Append -NoTypeInformation

    Start-Sleep -Seconds 60
}Bytes Total/sec is inbound + outbound combined. To separate them, use \Network Interface(*)\Bytes Received/sec and \Network Interface(*)\Bytes Sent/sec as two additional counter paths. This is useful when diagnosing whether a server is receiving large uploads or generating large downloads.
Hidden gems
The first sample is almost always wrong
The Windows performance counter infrastructure calculates rate-based values (like % Processor Time) as a delta between two readings. On the very first sample, there is no previous reading to compare against, so Windows returns either 0 or a meaningless value. This is not a PowerShell bug — it is how the counter API works. In scripts where the first value matters, add a warm-up sample before your collection loop: call Get-Counter once, discard the result, then start collecting.
# Warm-up sample — discard to avoid the first-reading artifact
Get-Counter '\Processor(_Total)\% Processor Time' | Out-Null
Start-Sleep -Seconds 2

# Now start real collection — values will be accurate from here
Get-Counter '\Processor(_Total)\% Processor Time' -MaxSamples 5 -SampleInterval 10
Per-process counters have dynamic instance names
When you query \Process(*)\% Processor Time to find which process is using the most CPU, the instance names match the process name — not the PID. If two instances of the same process are running (e.g., two svchost processes), Windows appends #1, #2 to disambiguate. These suffixes change each time the process restarts. If you are looking for a specific process by PID, you need to cross-reference with Get-Process.
# Find which process is consuming the most CPU right now
# Warm-up first, then sample
Get-Counter '\Process(*)\% Processor Time' | Out-Null
Start-Sleep -Seconds 2

Get-Counter '\Process(*)\% Processor Time' |
    Select-Object -ExpandProperty CounterSamples |
    Where-Object { $_.CookedValue -gt 1 } |          # filter out near-zero processes
    Sort-Object CookedValue -Descending |
    Select-Object -First 10 |
    Select-Object @{Name='Process'; Expression={$_.InstanceName}},
                  @{Name='CPU_%';   Expression={[Math]::Round($_.CookedValue, 1)}}
-Continuous streams data but cannot be piped directly to Export-Csv
Get-Counter -Continuous streams one sample object per interval to the pipeline. It works well for live display but cannot be used with Export-Csv directly — the CSV cmdlet expects the full collection to be complete before writing. Use a while loop with Export-Csv -Append (as in Example 4) for file-based logging. Use -Continuous only for live terminal display.
# Live terminal display — Ctrl+C to stop
# Note: this does NOT write to a file reliably
Get-Counter '\Processor(_Total)\% Processor Time' -Continuous -SampleInterval 5 |
    ForEach-Object {
        $val = [Math]::Round($_.CounterSamples[0].CookedValue, 1)
        Write-Host "$(Get-Date -Format 'HH:mm:ss')  CPU: $val%"
    }
Reference: most useful counters for server troubleshooting
These are the counters used across the rest of the PerfMon troubleshooting series. Copy the paths directly into Get-Counter calls or PerfMon Data Collector Sets.
| Category | Counter path | What to watch for |
|---|---|---|
| CPU | \Processor(_Total)\% Processor Time | Sustained >85% is a problem |
| CPU | \System\Processor Queue Length | >2 per core indicates saturation |
| CPU | \Process(*)\% Processor Time | Per-process breakdown |
| Memory | \Memory\Available MBytes | Below 200 MB on a server is critical |
| Memory | \Memory\% Committed Bytes In Use | Above 80% means RAM is under pressure |
| Memory | \Memory\Pages/sec | Consistently >1000 indicates paging |
| Memory | \Memory\Page Faults/sec | High value = working set doesn’t fit in RAM |
| Disk | \PhysicalDisk(_Total)\Avg. Disk Queue Length | >2 per spindle is a bottleneck |
| Disk | \PhysicalDisk(_Total)\Avg. Disk sec/Read | >20ms (HDD) or >1ms (SSD) is slow |
| Disk | \PhysicalDisk(_Total)\Avg. Disk sec/Write | Same thresholds as Read |
| Disk | \PhysicalDisk(_Total)\% Disk Time | Consistently near 100% = disk saturated |
| Network | \Network Interface(*)\Bytes Total/sec | Compare against NIC speed: 1 Gbps = 125 MB/s max |
| Network | \Network Interface(*)\Bytes Received/sec | Inbound traffic only — isolate download saturation |
| Network | \Network Interface(*)\Bytes Sent/sec | Outbound traffic only — isolate upload saturation |
| Network | \Network Interface(*)\Packets Received Errors | Non-zero = NIC or cable problem, not throughput |
| Network | \Network Interface(*)\Output Queue Length | >2 means outbound packets are queuing up |
Reading and parsing CSV logs
Once the logging script has run for a few hours, you have a CSV file on disk. Opening it in Excel works, but PowerShell lets you query, filter, and summarize the data without leaving the terminal — useful when you are already connected via RDP or SSH and just need quick answers.
Import the CSV and inspect the structure
# Import the log file — all columns come in as strings by default
$log = Import-Csv -Path 'C:\perf\srv-prod-01-log.csv'

# Check how many rows were collected and what the columns look like
$log.Count
$log | Select-Object -First 3
Output:
288

Timestamp            CPU_Pct  RAM_Available_MB  Disk_Queue
---------            -------  ----------------  ----------
04/28/2026 22:00:00  12.4     3204              0.008
04/28/2026 22:01:00  18.9     3198              0.012
04/28/2026 22:02:00 67.3 3101 0.041Import-Csv imports all values as strings, including numbers and timestamps. Before doing any math or date comparisons, cast the columns to the correct types — otherwise sorting and calculations will produce wrong results (string sort: “9” > “10”).
Cast types and calculate min / max / average
# Cast columns to correct types for accurate math and sorting
$data = Import-Csv -Path 'C:\perf\srv-prod-01-log.csv' | ForEach-Object {
    [PSCustomObject]@{
        Timestamp        = [datetime]$_.Timestamp
        CPU_Pct          = [double]$_.CPU_Pct
        RAM_Available_MB = [double]$_.RAM_Available_MB
        Disk_Queue       = [double]$_.Disk_Queue
    }
}

# Summary statistics for each metric
$data | Measure-Object -Property CPU_Pct -Minimum -Maximum -Average |
    Select-Object @{N='Metric'; E={'CPU_%'}}, Minimum, Maximum,
                  @{N='Average'; E={[Math]::Round($_.Average, 1)}}

$data | Measure-Object -Property RAM_Available_MB -Minimum -Maximum -Average |
    Select-Object @{N='Metric'; E={'RAM_Available_MB'}}, Minimum, Maximum,
                  @{N='Average'; E={[Math]::Round($_.Average, 0)}}

$data | Measure-Object -Property Disk_Queue -Minimum -Maximum -Average |
    Select-Object @{N='Metric'; E={'Disk_Queue'}}, Minimum, Maximum,
                  @{N='Average'; E={[Math]::Round($_.Average, 3)}}
Output:
Metric          Minimum  Maximum  Average
------          -------  -------  -------
CPU_%              4.1     94.7     31.2
RAM_Available_MB   812    3204     2891
Disk_Queue           0     8.14    0.043
Find all rows where a threshold was exceeded
# Show every sample where CPU exceeded 85% — with timestamp
$data | Where-Object { $_.CPU_Pct -gt 85 } |
    Select-Object Timestamp, CPU_Pct, RAM_Available_MB |
    Format-Table -AutoSize
Output:
Timestamp              CPU_Pct  RAM_Available_MB
---------              -------  ----------------
04/28/2026 22:47:00      91.3              2204
04/28/2026 22:48:00      88.7              2108
04/28/2026 22:49:00      94.7              1891
# Count how many samples exceeded the threshold and what percentage that is
$total = $data.Count
$above85 = ($data | Where-Object { $_.CPU_Pct -gt 85 }).Count
$pct = [Math]::Round($above85 / $total * 100, 1)
Write-Host "Samples above 85% CPU: $above85 of $total ($pct%)"Samples above 85% CPU: 14 of 288 (4.9%)Find the worst hour in the log
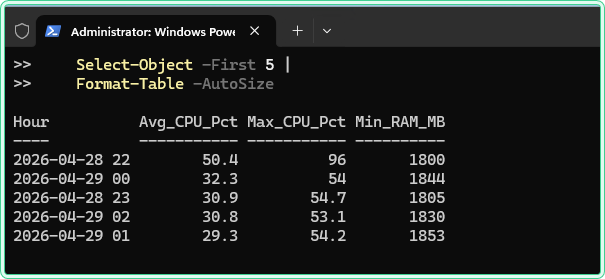
# Group samples by hour, calculate average CPU per hour, show worst 5
$data |
    Group-Object { $_.Timestamp.ToString('yyyy-MM-dd HH') } |
    ForEach-Object {
        $samples = $_.Group
        [PSCustomObject]@{
            Hour         = $_.Name
            Avg_CPU_Pct  = [Math]::Round(($samples | Measure-Object CPU_Pct -Average).Average, 1)
            Max_CPU_Pct  = ($samples | Measure-Object CPU_Pct -Maximum).Maximum
            Min_RAM_MB   = ($samples | Measure-Object RAM_Available_MB -Minimum).Minimum
        }
    } |
    Sort-Object Avg_CPU_Pct -Descending |
    Select-Object -First 5 |
    Format-Table -AutoSize
Output:
Hour              Avg_CPU_Pct  Max_CPU_Pct  Min_RAM_MB
----              -----------  -----------  ----------
2026-04-28 22           61.3         94.7         812
2026-04-28 23           44.8         78.2        1204
2026-04-29 01           38.1         71.3        1841
2026-04-28 21           22.4         51.7        2704
2026-04-29 00           18.7         39.2        2991
Filter by time window
# Analyze only the overnight window: 11pm to 6am
# Useful for isolating batch job impact
$nightShift = $data | Where-Object {
    $_.Timestamp.Hour -ge 23 -or $_.Timestamp.Hour -lt 6
}

Write-Host "Night window samples: $($nightShift.Count)"
$nightShift | Measure-Object CPU_Pct -Average |
    Select-Object @{N='Avg_CPU_Night'; E={[Math]::Round($_.Average, 1)}}
# Analyze a specific time range by exact datetime
$start = [datetime]'2026-04-28 22:00:00'
$end = [datetime]'2026-04-28 23:00:00'
$data | Where-Object { $_.Timestamp -ge $start -and $_.Timestamp -le $end } |
Measure-Object CPU_Pct -Minimum -Maximum -Average |
Select-Object Minimum, Maximum,
@{N='Average'; E={[Math]::Round($_.Average, 1)}}Export a filtered subset to a new CSV
# Export only the high-CPU rows to a separate file for handoff or ticket attachment
$data | Where-Object { $_.CPU_Pct -gt 85 } |
    Export-Csv -Path 'C:\perf\cpu-alerts-only.csv' -NoTypeInformation

Write-Host "Exported $(($data | Where-Object { $_.CPU_Pct -gt 85 }).Count) alert rows"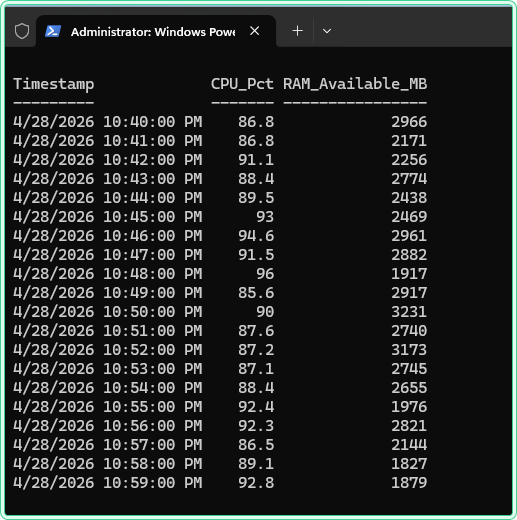
Import-Csv is still fast — PowerShell handles CSV files up to several hundred MB without issues. For very large files (500 MB+), consider using Get-Content with -ReadCount for streaming, or import into a SQLite database using the PSSQLite module for proper query support.
Tips and limitations
- Elevation is required for some counters. Most CPU and memory counters are readable without admin rights. Per-process counters and some disk counters may return empty results or errors in a non-elevated session. Run PowerShell as Administrator when in doubt.
- Counter names are locale-dependent. On Windows installations with a non-English UI language, counter object names and counter names are translated. A path that works on an English server will fail on a German or Russian one. Use
Get-Counter -ListSet *to find the local name, or standardize server OS language to English. - Disk counters require the Disk Performance counter to be enabled. On some older Windows Server configurations, physical disk counters return zero until you enable them with
diskperf -yand reboot. Rundiskperfin an elevated CMD to check the current state. - The
_Totalinstance aggregates across all instances. For CPU,_Totalis the average across all cores. For disk, it sums across all physical disks. If you need per-core or per-disk detail, query each instance individually:\Processor(0)\% Processor Time,\PhysicalDisk(0 C:)\Avg. Disk Queue Length, etc. - PowerShell 7 and Windows PowerShell 5.1 both support Get-Counter on Windows. There is no functional difference for the examples in this article. Use whichever version your environment standardizes on.
Official documentation
- Get-Counter — Microsoft Learn — full parameter reference and output object documentation
Related guides
- How to find what is causing high CPU on a Windows Server using Performance Monitor — uses the CPU counters from this article in a full PerfMon Data Collector Set investigation
- How to diagnose memory pressure on Windows Server with Performance Monitor — applies memory counters from the reference table above to a real leak investigation
- How to detect slow disk I/O on Windows Server using Performance Monitor — disk counter thresholds and DiskSpd load generation
- How to read Windows Event Logs with PowerShell — complement counter data with event log correlation using Get-WinEvent
- Event Log Analyzer — AI-powered tool for interpreting Windows event log entries that surface alongside performance problems