
The server is slow. Users are complaining. You open Task Manager and see CPU sitting at 90% — but Task Manager only shows a 60-second window and disappears the moment you close the RDP session. To find what is actually causing the problem — and prove it with data — you need Performance Monitor running a Data Collector Set in the background, capturing counter values to a file even when nobody is logged in. This article walks through the full investigation: setting up the collector, generating load to reproduce the problem, reading the graph, and identifying the responsible process.
Applies to: Windows Server 2016 / 2019 / 2022
Investigation workflow overview
The full investigation follows this sequence:
| Step | Action | Tool |
|---|---|---|
| 1 | Confirm the problem exists and is not a one-off spike | Task Manager / Resource Monitor |
| 2 | Set up a Data Collector Set to capture counters over time | Performance Monitor |
| 3 | Reproduce or wait for the high CPU condition | CPU stress tool or natural load |
| 4 | Stop collection and open the .blg report | Performance Monitor |
| 5 | Read the graph — identify when the spike happened | Performance Monitor |
| 6 | Drill into per-process data — find the responsible process | PowerShell + Performance Monitor |
| 7 | Correlate with Event Log if needed | Event Viewer / Get-WinEvent |
Step 1 — Quick confirmation with Task Manager and Resource Monitor
Before setting up a Data Collector Set, spend two minutes confirming the problem is real and ongoing — not a temporary spike from a Windows Update or antivirus scan that already finished.
Open Task Manager with Ctrl+Shift+Esc, go to the Performance tab, and watch the CPU graph for 60 seconds. If CPU is consistently above 70–80%, the problem is active. Switch to the Details tab and sort by CPU — this gives a rough process ranking, though the values fluctuate quickly.
For a better real-time view, open Resource Monitor:
resmon.exeThe CPU tab in Resource Monitor shows per-process CPU usage with a 60-second rolling graph per process — much easier to read than Task Manager’s Details tab. If one process is clearly dominating, note its name before proceeding.
Step 2 — Set up a Data Collector Set in Performance Monitor
A Data Collector Set runs as a background service — it captures counter values at a fixed interval and writes them to a .blg file. It keeps running even when the RDP session is disconnected and survives a user logoff. This is the right tool for catching intermittent spikes.
Open Performance Monitor:
perfmon.exeIn the left pane, expand Data Collector Sets → right-click User Defined → New → Data Collector Set.
In the wizard:
- Name:
CPU-Investigation - Select Create manually (Advanced) → Next
- Check Performance counter → Next
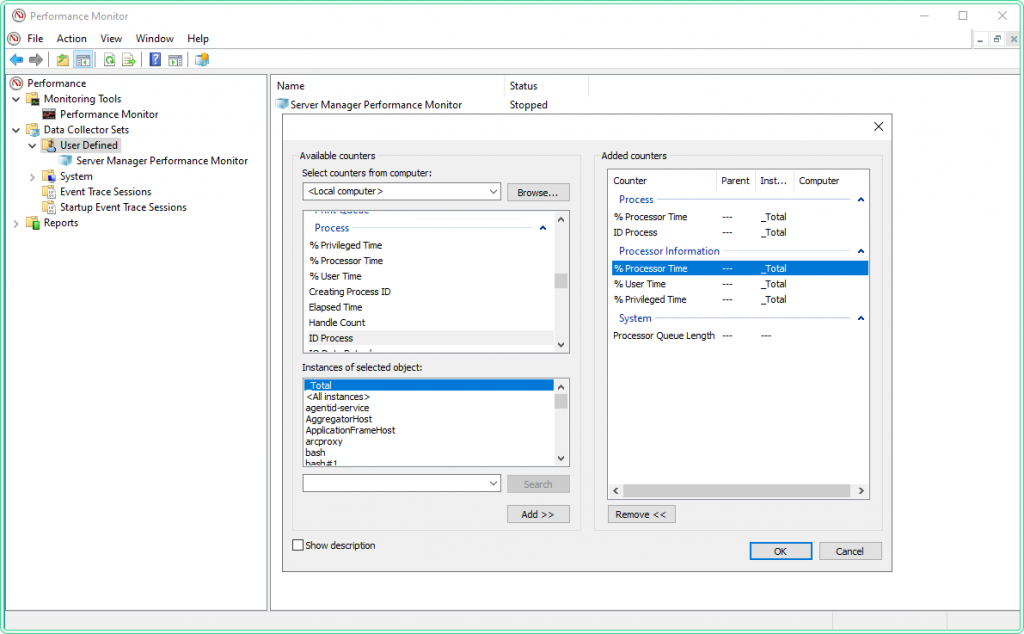
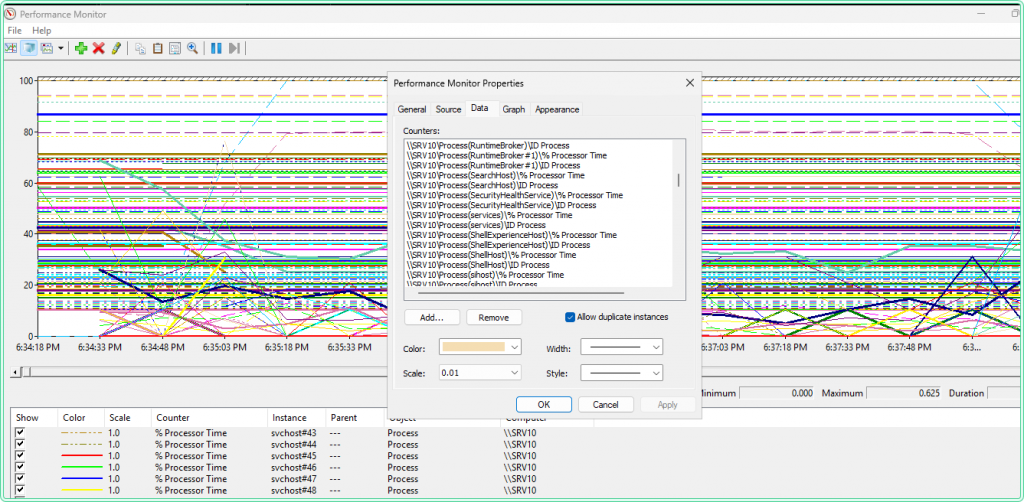
- Click Add… to open the counter picker
Add the following counters — these cover total CPU load, saturation queue, and per-process breakdown:
| Counter object | Instance | Counter name | Purpose |
|---|---|---|---|
| Processor Information | _Total | % Processor Time | Overall CPU load |
| Processor Information | _Total | % User Time | User-space vs kernel split |
| Processor Information | _Total | % Privileged Time | Kernel-mode CPU — high = driver/OS issue |
| System | — | Processor Queue Length | Threads waiting for CPU — >2 per core = saturation |
| Process | * | % Processor Time | Per-process CPU — use * to capture all |
| Process | * | ID Process | PID for each process instance — needed for correlation |
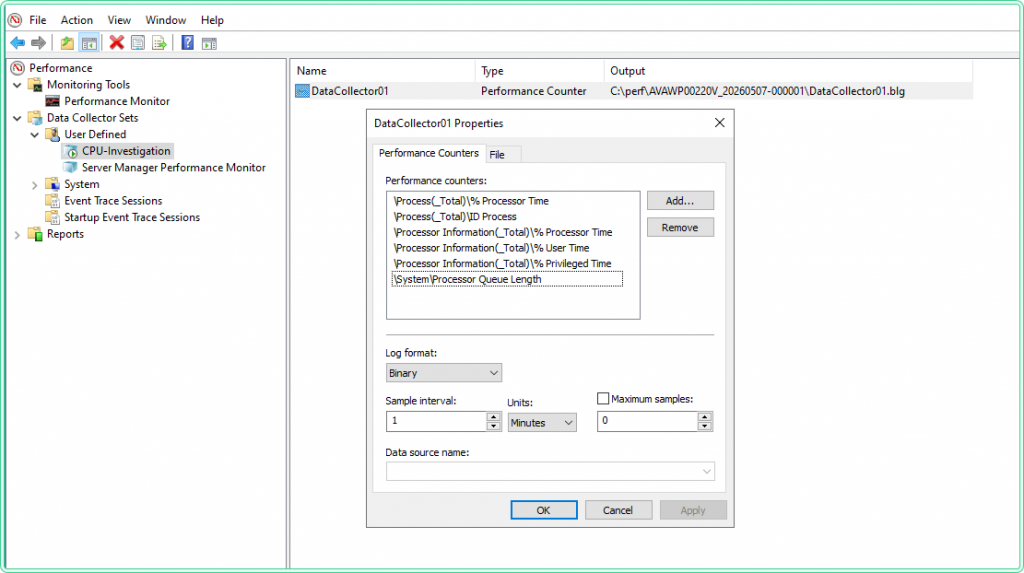
Process(*)\% Processor Time counter captures every running process. On a busy server with 100+ processes, this adds up to a larger log file. For a short investigation (a few hours), this is fine. For multi-day collection, remove the per-process counters and add them back only when you have narrowed the timeframe using the total CPU counter first.
After adding counters, set the Sample interval to 15 seconds for an active investigation, or 60 seconds for overnight monitoring. Click Next, choose a save location (e.g., C:\perf\), and click Finish.
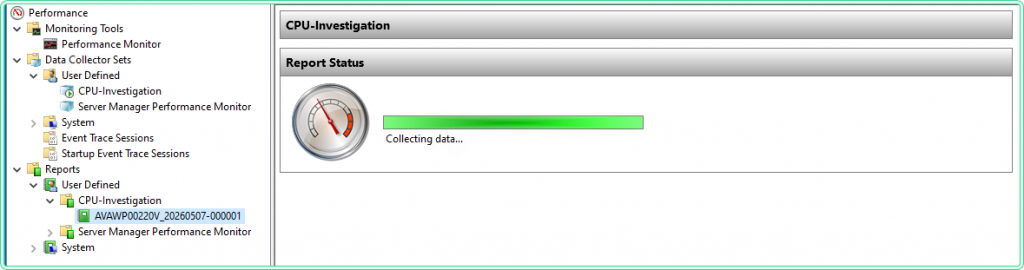
To start the collector: right-click CPU-Investigation in the left pane → Start. The green icon confirms it is running.
To do the same from PowerShell instead of the GUI:
# Create a Data Collector Set for CPU investigation using logman
# Run elevated

logman create counter CPU-Investigation `
    -c "\Processor Information(_Total)\% Processor Time" `
       "\Processor Information(_Total)\% Privileged Time" `
       "\System\Processor Queue Length" `
       "\Process(*)\% Processor Time" `
       "\Process(*)\ID Process" `
    -si 15 `
    -f bin `
    -o "C:\perf\cpu-investigation"

# Start it
logman start CPU-Investigation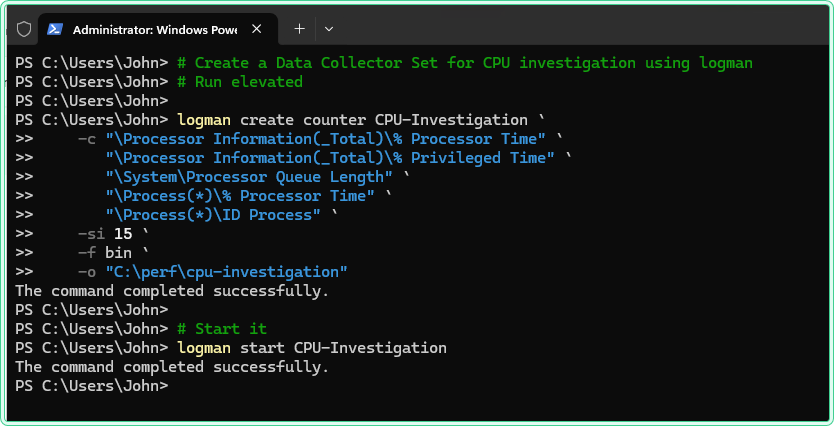
# Check that it is running
logman query CPU-Investigation
Name: CPU-Investigation
Status: Running
Output: C:\perf\cpu-investigation.blg
File Mode: LinearStep 3 — Reproduce the load with a stress tool
If the high CPU condition happens naturally (a batch job, a scheduled task, a specific user action), let the collector run and wait. If you need to reproduce it on demand — for testing, for validating the setup, or for demonstrating the problem to a vendor — use a CPU stress tool to generate controlled load.
Option A — CPU Stress (Sysinternals)
Download: https://learn.microsoft.com/en-us/sysinternals/downloads/cpustres — official Microsoft Sysinternals tool, no installation required, single executable.
CPU Stress creates worker threads and lets you control how many threads run and at what activity level (Low / Medium / Busy / Maximum). It is the most precise option for targeted testing — you can ramp load up and down while watching PerfMon graphs respond in real time.
How to use:
- Extract and run
CPUSTRES64.exeas Administrator - The tool shows 4 worker threads by default (Thread 1–4)
- Right-click each thread → Activity Level → set to Maximum to generate full load
- Check the Active checkbox on each thread to start it
- To control how many cores are loaded: activate only the number of threads matching the cores you want to stress
- To stop: uncheck Active on all threads
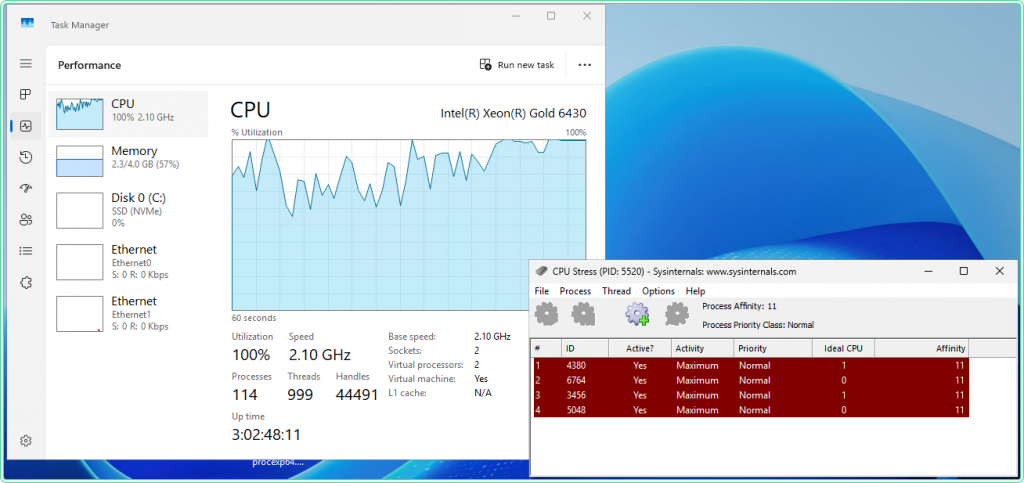
CPUSTRES64. This makes it easy to verify that the tool is what is driving the spike — which is exactly what you want when validating the Data Collector Set setup.
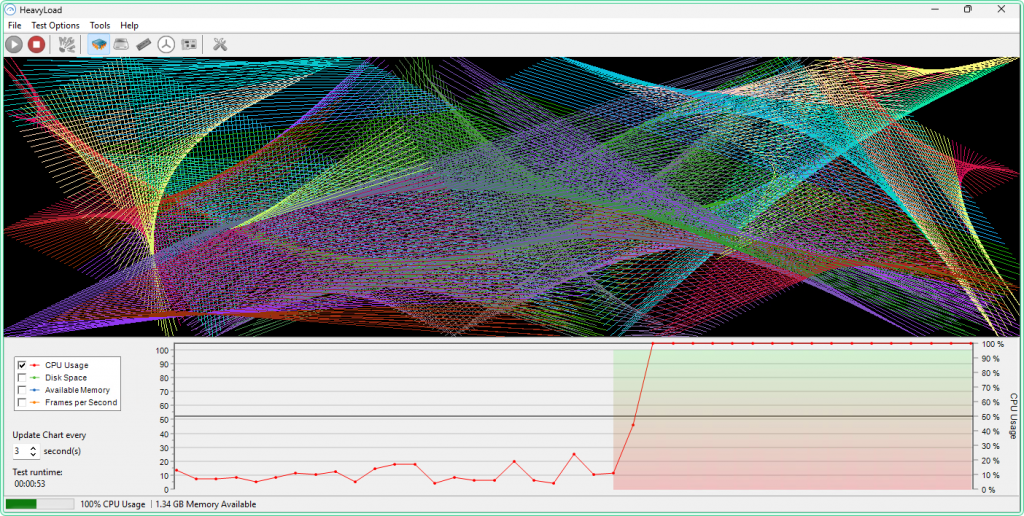
Option B — HeavyLoad (JAM Software)
Download: https://www.jam-software.com/heavyload — free for personal and commercial use, installer-based.
HeavyLoad can stress CPU, RAM, and disk simultaneously from a single interface — useful when you want to reproduce a combined load scenario (e.g., a backup process that hits CPU and disk at the same time). For CPU-only testing, set the CPU slider to the desired percentage and leave RAM and disk at zero.
How to use:
- Install and run HeavyLoad as Administrator
- In the main window, check Stress the CPU and set the load percentage using the slider (start at 80% to simulate a realistic spike)
- Leave Allocate Memory and Write Testfile unchecked for CPU-only testing
- Click Start (the play button)
- To stop: click Stop
Step 4 — Stop collection and open the report
After the high CPU condition has occurred — either naturally or via a stress tool — stop the Data Collector Set: right-click CPU-Investigation → Stop. Or from PowerShell:
# Stop the collector
logman stop CPU-Investigation
Navigate to C:\perf\ and open the .blg file — it opens directly in Performance Monitor. Alternatively, in the left pane of PerfMon, click Performance Monitor, then drag the .blg file onto the graph area.
.blg file is a binary log — it can only be opened in Performance Monitor or converted to CSV using relog. If you need to share the data with someone who does not have PerfMon access, convert it first: relog C:\perf\cpu-investigation.blg -f CSV -o C:\perf\cpu-investigation.csv
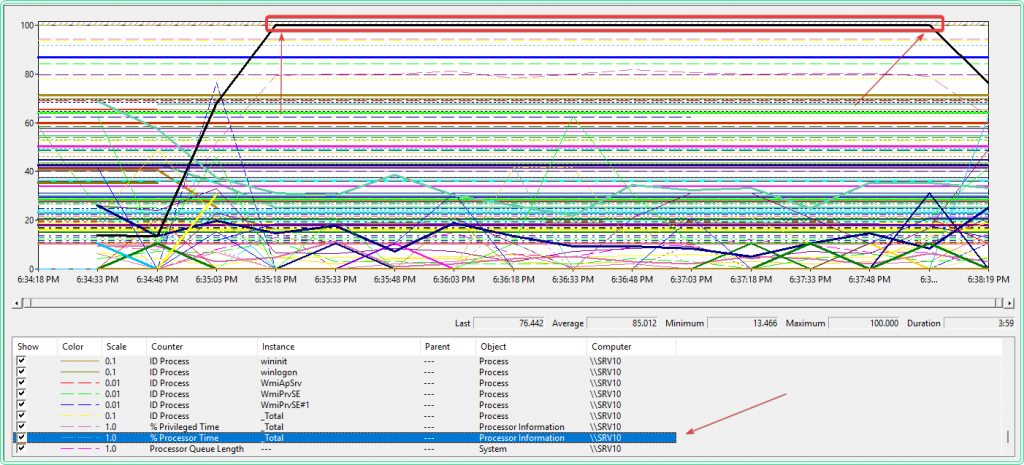
Step 5 — Read the graph and identify the spike
When the .blg file opens, PerfMon shows all collected counters as lines on a graph. The first thing to do is isolate the % Processor Time (_Total) line to see the overall CPU pattern before adding per-process detail.
To isolate one counter: click its row in the legend at the bottom of the graph → press Ctrl+H to highlight it (the selected line turns bold, others dim). Use this to read individual counters without visual noise from the other lines.
What to look for on the total CPU graph:
| Pattern | What it means |
|---|---|
| Sustained high plateau (>80% for 10+ minutes) | Continuous workload — a process is running without pause |
| Sharp spike then drop | A scheduled task or triggered job — note the exact timestamp |
| Sawtooth pattern (repeating spikes) | A recurring job or polling loop — check Task Scheduler |
| Gradual increase over hours | Memory leak or queue buildup pushing more CPU work |
| % Privileged Time high alongside total CPU | Kernel-mode activity — driver issue, antivirus, or I/O pressure |
Note the exact time window of the spike — you will use it in the next step. To zoom into a specific range: click and drag across the graph to select the spike window, then right-click → Zoom To.
Step 6 — Drill into per-process data and find the culprit
Opening the .blg file with Process(*)\% Processor Time included adds dozens — sometimes hundreds — of lines to the graph. On a server with 60+ processes this is unreadable. The right approach is to use PowerShell to parse the log first, find the top CPU consumers during the spike window, and then add only those specific processes to the PerfMon graph.
6a — Convert .blg to CSV and find the top processes
First, convert the binary log to CSV using relog. Check C:\perf\ in File Explorer for the exact filename — PerfMon appends a numeric suffix automatically:
relog C:\perf\cpu-investigation_000001.blg -f CSV -o C:\perf\cpu-investigation.csv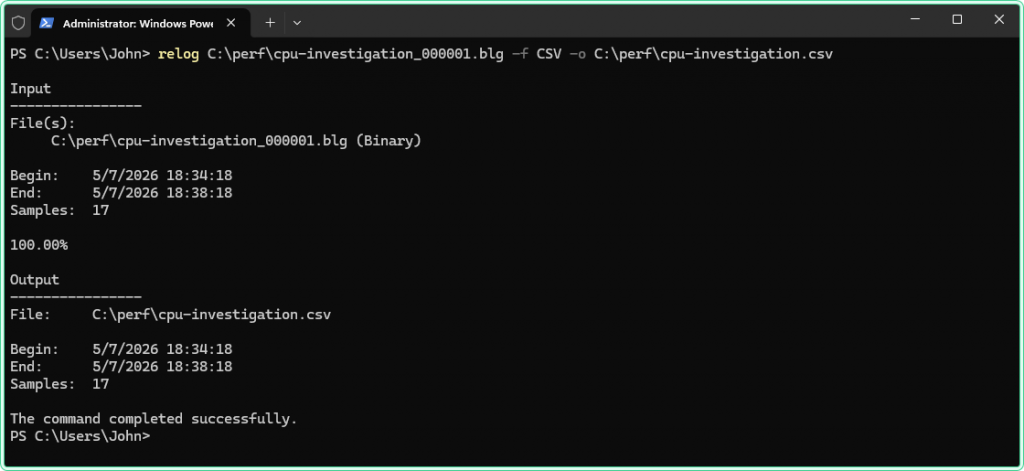
Now import the CSV in PowerShell and find the top CPU consumers during the spike window. Adjust the $SpikeStart and $SpikeEnd timestamps to match what you saw on the graph in Step 5:
# Import the CSV — relog names the timestamp column with a long PDH header
$raw          = Import-Csv 'C:\perf\cpu-investigation.csv'
$timestampCol = $raw[0].PSObject.Properties.Name | Select-Object -First 1

# Cast timestamp and preserve all other columns
$data = $raw | ForEach-Object {
    $row = [ordered]@{ Timestamp = [datetime]$_.$timestampCol }
    foreach ($prop in $_.PSObject.Properties) {
        if ($prop.Name -ne $timestampCol) { $row[$prop.Name] = $prop.Value }
    }
    [PSCustomObject]$row
}

# Filter to the spike window identified in Step 5
$SpikeStart = [datetime]'2026-04-28 22:40:00'
$SpikeEnd   = [datetime]'2026-04-28 23:00:00'
$spike      = $data | Where-Object { $_.Timestamp -ge $SpikeStart -and $_.Timestamp -le $SpikeEnd }

Write-Host "Rows in spike window: $($spike.Count)"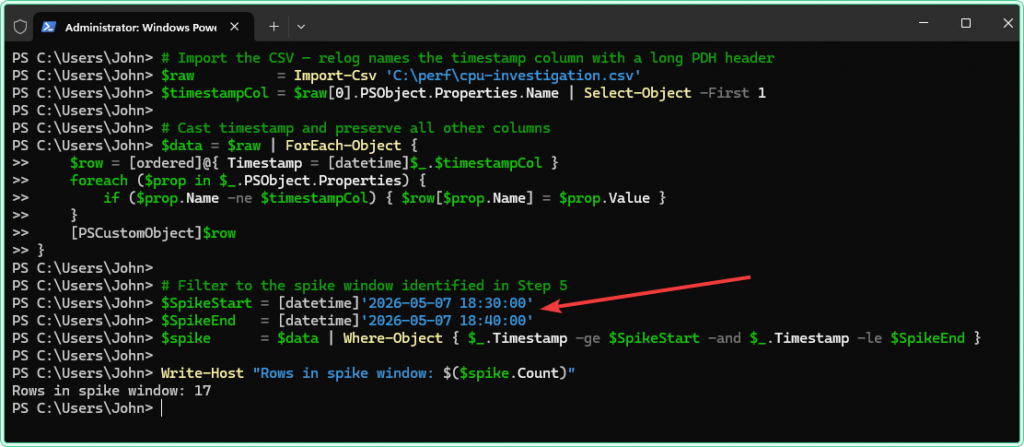
# Find all per-process CPU columns and calculate the max value during the spike
$processCols = $data[0].PSObject.Properties.Name |
    Where-Object { $_ -like '*\Process(*)\% Processor Time' }

$results = foreach ($col in $processCols) {
    $procName = [regex]::Match($col, 'Process\((.+?)\)').Groups[1].Value
    if ($procName -in '_total', 'idle') { continue }

    $maxVal = ($spike | ForEach-Object {
        $v = ($_.$col).Trim()
        if ($v -ne '') { [double]$v } else { 0 }
    } | Measure-Object -Maximum).Maximum

    [PSCustomObject]@{
        Process = $procName
        Max_CPU = [Math]::Round($maxVal, 1)
    }
}

# Show top 10 — the culprit will be at the top
$results | Sort-Object Max_CPU -Descending | Select-Object -First 10 | Format-Table -AutoSize
Output example:
Process          Max_CPU
-------          -------
CPUSTRES64         388.4
svchost#12          18.3
MsMpEng              9.1
svchost#3            6.7
SearchIndexer 4.2Process\% Processor Time is not normalized — a value of 388% on a 4-core server means the process consumed roughly all 4 cores. The total CPU counter is normalized to 0–100% across all cores. When comparing them in PerfMon, look at the shape and timing of the spike, not the absolute values.
6b — Add only the top processes to PerfMon for a clean graph
Now that you know which processes were active during the spike, go back to the PerfMon graph and add only those — not *.
- If the graph currently shows all processes: right-click the legend area → Remove All Counters
- Click the + button → add
Processor Information(_Total)\% Processor Time - Add
Process(CPUSTRES64)\% Processor Time— use the exact process name from the PowerShell output - Optionally add the second and third suspect from the list if the first does not account for the full spike
- Click the suspect process row in the legend → press
Ctrl+Hto highlight it
The graph now shows two or three lines — total CPU and the specific suspects. The shape and timing of the suspect line matching the total CPU spike is the confirmation.
[Screenshot placeholder — Performance Monitor: clean graph with only Processor Information(_Total) and Process(CPUSTRES64), CPUSTRES64 highlighted with Ctrl+H, spike clearly visible and matching]
6c — Get process details for the identified culprit
If the process is still running, get its full path and what launched it:
# Get path and parent process — run while the process is still active
$proc = Get-Process -Name 'CPUSTRES64' -ErrorAction SilentlyContinue

if ($proc) {
    $proc | Select-Object Id, Name,
        @{N='Path';      E={ $_.MainModule.FileName }},
        @{N='StartTime'; E={ $_.StartTime }}

    # What launched this process?
    $parentId = (Get-CimInstance Win32_Process -Filter "ProcessId=$($proc.Id)").ParentProcessId
    Get-Process -Id $parentId | Select-Object Id, Name
} else {
    Write-Host "Process not running — check the ID Process counter in the CSV for its PID"
}
If the process has already exited, retrieve its PID from the ID Process counter that was captured in the log:
# Get the PID of the culprit process from the ID Process counter during the spike window
$pidCol = $data[0].PSObject.Properties.Name |
    Where-Object { $_ -like '*Process(CPUSTRES64)*ID Process*' } |
    Select-Object -First 1

if ($pidCol) {
    $savedPid = $spike | ForEach-Object { $_.$pidCol } |
        Where-Object { $_ -and $_ -ne '' } |
        Select-Object -First 1
    Write-Host "CPUSTRES64 PID during spike: $savedPid"
}
6d — Show when the process held high CPU and for how long
Once you have identified the culprit, extract its timeline from the log — when it started consuming CPU, how long it held load, and when it stopped. If the process spiked multiple times during the collection window, the script groups them into separate episodes by detecting gaps between active samples. This is useful for correlating with scheduled tasks, user actions, or application events, and for documenting the incident.
# Detect multiple separate high-CPU episodes for a process
# A new episode starts when the gap between samples exceeds $GapMinutes
$GapMinutes = 5     # gap threshold — adjust to your sample interval
$Threshold  = 10    # CPU% above which counts as active load

$procCol = $data[0].PSObject.Properties.Name |
    Where-Object { $_ -like '*Process(CPUSTRES64)*% Processor Time*' } |
    Select-Object -First 1

if ($procCol) {
    # Get all rows above threshold
    $active = $data | Where-Object {
        $v = ($_.$procCol).Trim()
        $v -ne '' -and [double]$v -gt $Threshold
    } | Select-Object Timestamp,
        @{N='CPU_%'; E={ [Math]::Round([double]($_.$procCol).Trim(), 1) }}

    if (-not $active) {
        Write-Host "No samples above threshold found"
        return
    }

    # Group into episodes by gap
    $episodes = @()
    $start    = $active[0]
    $prev     = $active[0]

    for ($i = 1; $i -lt $active.Count; $i++) {
        $gap = ($active[$i].Timestamp - $prev.Timestamp).TotalMinutes
        if ($gap -gt $GapMinutes) {
            # Close current episode
            $episodes += [PSCustomObject]@{
                Episode  = $episodes.Count + 1
                From     = $start.Timestamp
                To       = $prev.Timestamp
                Duration = [Math]::Round(($prev.Timestamp - $start.Timestamp).TotalMinutes, 1)
                Samples  = $i - ($active.IndexOf($start))
                Max_CPU  = ($active[$active.IndexOf($start)..($i-1)] |
                               Measure-Object CPU_% -Maximum).Maximum
            }
            $start = $active[$i]
        }
        $prev = $active[$i]
    }

    # Close last episode
    $episodes += [PSCustomObject]@{
        Episode  = $episodes.Count + 1
        From     = $start.Timestamp
        To       = $prev.Timestamp
        Duration = [Math]::Round(($prev.Timestamp - $start.Timestamp).TotalMinutes, 1)
        Samples  = $active.Count - $active.IndexOf($start)
        Max_CPU  = ($active[$active.IndexOf($start)..($active.Count-1)] |
                       Measure-Object CPU_% -Maximum).Maximum
    }

    $episodes | Format-Table -AutoSize
}
Output example:
Episode From                To                  Duration Samples Max_CPU
------- ----                --                  -------- ------- -------
1 5/7/2026 6:35:09 PM 5/7/2026 6:38:18 PM 3.2 14 188.9-gt 10 defines what counts as “active load” for this process. On an idle server a value of 5 is sufficient. On a server with background services always running, raise it to 20–30 to avoid counting normal baseline activity as part of the high CPU period. Adjust it to match what you observed as the normal baseline for this process in the log.
Step 7 — Correlate with Event Log
Once you know when the spike happened and which process caused it, cross-reference with the Windows Event Log to find what triggered that process. This step is particularly useful when the culprit is a system process (svchost, antivirus service, Windows Update) where the process name alone does not explain the cause.
# Search System and Application logs for errors during the spike window
$SpikeStart = [datetime]'2026-04-28 22:40:00'
$SpikeEnd   = [datetime]'2026-04-28 23:00:00'

Get-WinEvent -FilterHashtable @{
    LogName   = 'System', 'Application'
    Level     = 1, 2
    StartTime = $SpikeStart
    EndTime   = $SpikeEnd
} -ErrorAction SilentlyContinue |
    Select-Object TimeCreated, ProviderName, Id, Message |
    Format-List
# Check Task Scheduler operational log — catches scheduled tasks that fired during the spike
Get-WinEvent -FilterHashtable @{
LogName = 'Microsoft-Windows-TaskScheduler/Operational'
StartTime = $SpikeStart
EndTime = $SpikeEnd
} -ErrorAction SilentlyContinue |
Where-Object { $_.Id -in 100, 102, 200, 201 } |
Select-Object TimeCreated, Id, Message |
Format-Listtaskschd.msc to see the full command line and schedule.
For a deeper look at Event Log analysis alongside performance data, see How to read Windows Event Logs with PowerShell.
Common patterns and what they mean
svchost.exe is the top CPU consumer
svchost.exe is a host process for Windows services — many services run inside it. Seeing svchost at the top does not tell you which service is responsible. Use Resource Monitor (CPU tab → Services column) to see which service inside a specific svchost instance is active. Alternatively, from an elevated PowerShell session, run Get-CimInstance Win32_Process -Filter "Name='svchost.exe'" | Select-Object ProcessId, CommandLine to see which services each instance hosts.
% Privileged Time is high but % User Time is normal
This pattern points to kernel-mode activity rather than application code. Common causes: a driver in a tight loop (network, storage, or GPU driver), antivirus kernel filter performing heavy I/O scanning, or a hardware interrupt storm. Check the hardware event log and driver event providers in Event Viewer. If this happens on a VM, check host-side performance as well — hypervisor overhead appears as Privileged Time on the guest.
Processor Queue Length stays above 4–8 even when total CPU drops
Processor Queue Length measures threads that are ready to run but waiting for a CPU core to become available. A sustained queue above 2 per core indicates CPU saturation — threads are backing up. If the total CPU % drops but the queue stays high, it usually means the CPU is releasing and immediately getting grabbed again by new work — the system never has idle time long enough to drain the queue. This is a sign the server is genuinely undersized for the workload, not just experiencing a temporary spike.
The spike is perfectly periodic — every 1 hour or every day at the same time
A perfectly periodic spike almost always comes from Task Scheduler. Check taskschd.msc for tasks scheduled to match the interval. Also check Windows Defender scheduled scans, SQL Server Agent jobs, and backup agents — all of which commonly cause periodic CPU spikes that look alarming but are expected behavior.
Tips and limitations
- Set a maximum log file size for long-running collections. Right-click the Data Collector Set → Properties → Stop Condition tab → check Maximum Size and set it to 500 MB. At 15-second intervals with per-process counters, a 500 MB file covers roughly 12–24 hours. Without a size limit, the file grows until the disk fills up.
- Use Circular logging for continuous monitoring. In the collector properties → Stop Condition tab → check Restart the data collector set at limits. This starts a new file when the size limit is reached and overwrites the oldest data — useful for keeping a rolling 24-hour window without manual intervention.
- Per-process counters only capture processes running when the sample fires. If a process starts, spikes CPU for 5 seconds, and exits before the 15-second sample interval fires, it will not appear in the log. For short-lived processes, reduce the sample interval to 5 seconds during the investigation window, or use the PowerShell
Get-Counterloop with a 5-second interval running in parallel. - The
.blgfile path must exist before the collector starts. If you specifyC:\perf\as the output path, create the folder first — PerfMon will not create it automatically and the collector will fail to start silently. - Antivirus exclusions for the log output folder. On servers with aggressive real-time scanning, the antivirus may lock the
.blgfile during a scan, causing the collector to write errors to the event log. AddC:\perf\to the antivirus exclusion list to avoid this.
Official documentation
- logman — Microsoft Learn — command-line tool for creating and managing Data Collector Sets
- CPU Stress — Sysinternals — official download page
- HeavyLoad — JAM Software — free CPU/RAM/disk stress tool
Related guides
- Get-Counter in PowerShell: monitor Windows Server performance from the command line — PowerShell alternative to PerfMon for capturing the same counters without the GUI, including CSV logging and parsing
- How to diagnose memory pressure on Windows Server with Performance Monitor — same Data Collector Set approach applied to RAM investigation
- How to detect slow disk I/O on Windows Server using Performance Monitor — disk counters and DiskSpd load generation
- How to read Windows Event Logs with PowerShell — correlate PerfMon spike timestamps with Event Log entries using Get-WinEvent
- Event Log Analyzer — AI-powered tool for interpreting Windows event log entries that surface alongside performance problems